Topic 200: Capacity Planning
200.1 Measure and Troubleshoot Resource Usage
The main goal of the capacity planning is to deliver short-, mid-, and long-term optimal performance of the IT systems.
Systems performance is closely linked to the operating cost. Not only in terms of hardware, but man-hours spent on performance tuning. Historically it was more cost effective to try to fine-tune software configuration, for example the applications running on the machine, kernel and kernel modules to gain better performance, in today’s world most of the non-enterprise configuration issues are resolved with more powerful hardware.
Both Linux and Windows systems come with built-in tools allowing the IT administrator to understand current and predict future resource allocation.
Basic capacity planning requires the below:
- Creating a baseline and get to know your system well.
- Measurement of the current usage on daily, weekly and monthly cycle.
- Troubleshooting of the high resource usage – traffic spikes, I/O issues.
- Predicting the future resource usage in relation to hardware and software changes.
With this in mind, let’s have a look at the key knowledge areas:
Systems usually break down into these resources: Processing power (CPU), Memory (RAM) and (hard disk, SSD, NVME) collectively known as disk I/O.
Identifying the CPU(s)
Days of single CPU systems are long gone, most of the modern CPUs have multiple cores, enterprise servers can have more than one processor installed on the motherboard.
Before we start measuring the CPU usage, it is important to understand the specifics of the CPU installed on your machine. This information is stored in the proc filesystem, in the file called cpuinfo. You can also use the lscpu command to list this information in more human readable way.
If you send a cat in (the cat command) you will be provided with a wealth of information, it may be sensible to grep for cores or model name as per examples below:
[root@jakku ~]# cat /proc/cpuinfo | grep "cores"
cpu cores  : 1

[root@jakku ~]# cat /proc/cpuinfo | grep "model name"
model name  : Intel(R) Xeon(R) Gold 5120 CPU @ 2.20GHz
Measuring the current CPU usage with uptime command
The quickest way to verify the current (last 15 minutes) CPU usage is with the uptime command. This command takes no arguments and by default provides you with current time, system uptime, number of logged in users and load average.
Load average can serve for the baseline of the system performance. This industry standard metric has no units. The scale goes from 0.00 (idle, most of the tasks are sleeping) to as high as 60 or 120 (for multicore systems).
On Linux systems,
load average includes all running and waiting tasks to show potential CPU demand on the given machine. For example, if your drive is very slow, tasks would queue more often due to low I/O, this would be reflected in higher load average.
If you swap the drive for a fancy NVMe or SSD, for the same processes running, the load average should be lower.
Below you have some examples from my Linux machines.
[root@jakku ~]# uptime
 23:07:45 up 10 days, 11:13, 1 user, load average: 0.00, 0.00, 0.00
My system has load average of 0.00 for 1,5 and 15 minutes. System is completely idle.
kaz@desktop:~$ uptime
 13:09:26 up 1:36, 1 user, load average: 1.72, 1.95, 1.76
Another example is my desktop, which has 4 cores, the highest value was 1.95 which is half of what my CPU can process without being clogged up.
One more example for a good measure.
[vagrant@playground ~]# uptime
 21:17:14 up 6:54, 1 user, load average: 0.68, 0.52, 0.54
My system has 1 (virtual) core and load average of 0.68 meaning that system is running at the optimal load (utilising between 50 to 70% of the CPU time).
My system has only one (virtual) core, if the load average was 1.00 it would mean that CPU is occupied at 100%. Any additional tasks would have to wait for the CPU to be free enough. This is not really a problem for CPU, your load can be around 2.00 or 3.00. Single core system would be noticeably slow at such a high load.
Uptime cheat sheet
With three values provided by uptime command, you can easily tell if demand for the CPU time is going up or down, always use the numbers provided by this command in some wider context. Re-run the uptime command 10 minutes later to see if the
load was not generated by reckless user, who decided to compile the kernel during his lunch break on busy, shared system.
How to read the uptime results
0.00 – System completely idle
If the 1 minute average (first from the left) is higher than 5 and 15 (middle and right values), load is increasing.
If the 1 minute average (first from the left) is lower than 5 and 15 (middle and right
values), load is increasing.
Load average is higher than the number of CPU cores – System is running at max CPU power.
Main factors affecting the load average (organised by impact)
- Number of CPUs and vCores and CPU utilisation
- Number of running processes
- Amount of RAM and swap memory
- Storage I/O and Filesystem I/O
- Network I/O
Good and bad load average
There is no universal value due to the way how load average is being calculated around the I/O of the hardware. Ideally it would be a value, which keeps the system fairly occupied with as little of complaints from the users regarding
the performance of the given system. This would be around 75% of the available resources. Lets translate it into example systems, for the peak times.
- Single core system – load average of 0.75
- Two core system – load average of 1.75
- Four core system – load average of 3.75
From the Linux system perspective, demanding tasks can go over the values above and system somewhat would remain stable and responsive. Desktops tend to lag at higher load averages in comparison to command-line operated servers, which may
just take a second or two longer to process the current task queue. Busy web server will be slow and unresponsive at high load average where mail server should just operate fine.
With what we have learned so far, we can tell if system is generally busy or not. Next we will learn, how to verify which tasks, processes and programs are resource hungry.
Measuring the current CPU and memory usage with top command
With high load average, ideally we would like to which resources are in high demand on our machine. Top command gives us some basic insight into why this may be the case.
When you type in top and press enter you should be familiar with the first row of output. It is nothing but current time, number of logged in users and load average for 1,5 and 15 minutes.
The next line of text provides you with tasks running on the system. You can see the total number of processes and the state they are in.
Tasks: 81 total, 1 running, 80 sleeping, 0 stopped, 0 zombie
List of states in which the tasks (processes) can be:
- Running
- Sleeping
- Stopped
- Zombie
As a baseline, freshly installed CentOS 8 has 81 processes running out of box, my desktop has 302 processes running on average.
Third line is all about the CPU usage. In our example, system is a little busy (79.1 id) with 6.7 user processes ( 6.7 us) and 6.9 system processes.
%Cpu(s): 6.7 us, 6.9 sy, 0.2 ni, 79.1 id, 1.6 wa, 0.0 hi, 5.6 si, 0.0 st
As per man pages, I have highlighted the values we focus on.
us, user : time running un-niced user processes
sy, system : time running kernel processes
ni, nice : time running niced user processes
id, idle : time spent in the kernel idle handler
wa, IO-wait : time waiting for I/O completion
hi
: time spent servicing hardware interrupts
si : time spent servicing software interrupts
st : time stolen from this vm by the hypervisor
In similar fashion we can see memory and swap usage in next two rows.
MiB Mem :  477.4 total,  127.5 free,  120.1 used,  229.9 buff/cache
MiB Swap:  2048.0 total,  2048.0 free,   0.0 used.  338.8 avail Mem
Below you have a list of all processes running on the system.

PID stands for Process ID and it is really useful when we want to track down or kill the process.
Next field explains, which user has started and is running this process.
With top we can sort process list for specific order.
Press shift + M to sort the order for the memory usage
Press shift + P to sort the order for the processor usage
Press k and type in the PID of the
process you want to kill
Press q to quit the top utility.
Measure memory usage
The main tools to see the memory usage from most basic information to wealth of detail.
Free -m command to show the amount of total, free and used memory and swap in megabytes. You can also use the -h switch to see the results in human readable values (Gigabytes). Command provides you with the static printout, which does not refresh unless you run the same command again. There is a hack for this, you can combine watch and free command, what watch command does is repeats the given command every 2 seconds and refreshes the screen. Example usage: watch -d free -m This combination will provide the memory output in megabytes, changes on screen would be updated and highlighted every 2 seconds.

Press Control + C to quit the watch command.
Memory information for the free command is pulled from /proc/meminfo and formatted into easily readable output.
If you wish to see the dynamic memory usage try htop utility. Which looks like this:

Use arrow keys (Up and Down) to navigate the list of processes running on the system.
Press shift + M to sort the order for the memory usage
Press shift + P to sort the order for the processor usage
Press k and type in the PID of the
process you want to kill
Press q to quit the htop utility.
Monitoring the Input/Output and device load
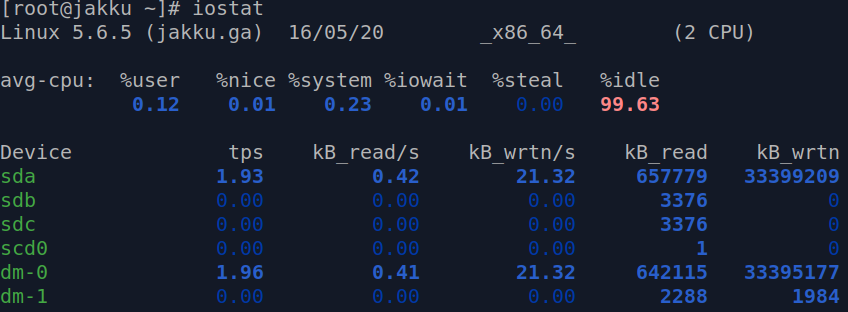
Iostat is a handy utility which provides the system administrator with input and output (I/O) statistics for CPU, disks and partitions. If you type just iostat on its own, you will be presented with statistics since last reboot.
Output of the iostat command on the idle CentOS 8 system.

Example of the load generated on the sda device. Compare the %system and %iowait values. For comparison sdb and sdc devices being completely idle.
Core values for the CPU usage:
%idle value describes the percentage of the time when CPU was idle, where value of 99.63 represents a completely idle system and 35.88 is somewhat busy Linux machine.
%iowait value starts with 0.01 for the idle system, where 23.42 would mean that processor has to put some of the currently running tasks in a queue. This would be the indication of a degraded performance, example – multiple heavy operations on the same filesystem.

Core values for the disk usage:
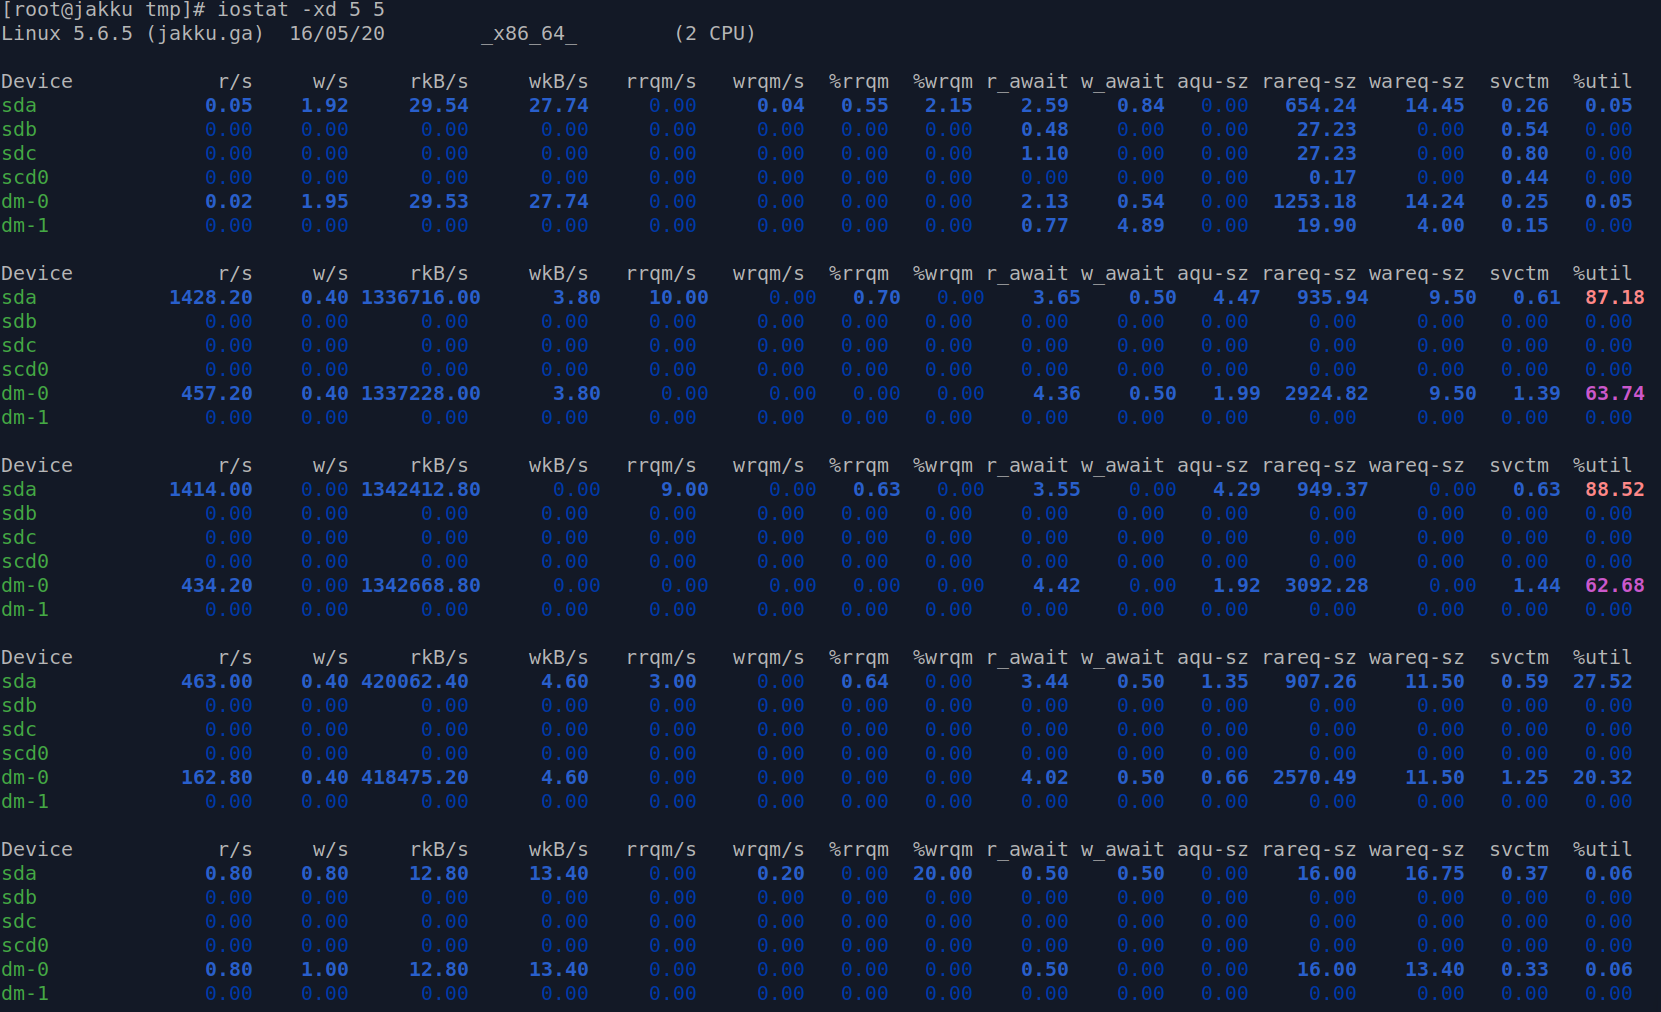
%util represents the bandwidth utilisation for the given device, 0.0 represents idle disk where value close to 100 represents saturation.
In this example I have used the iostat with -xdh switches to track a temporary spike of the disk usage. The switches I use are -x for the extended statistics, -d for the device utilisation and -h for human readable values. First of the two fives represent the 5 second interval the second number 5 represents the number of reports requested. Therefore iostat 2 10 would provide you with 10 reports gathered every 2 seconds.
[root@jakku tmp]# iostat -xdh 5 5

If you own a system with many drives installed, you can narrow down the output to a specific drive only with -p switch followed by the device name for example sda.
[root@jakku tmp]# iostat 2 10 -p sda
If you wish to generate a disk load on your test environment, you can adapt the commands below.
To generate a test 1GB file:
[root@jakku ~]# dd if=/dev/zero of=/tmp/1g.bin bs=1G count=1
To generate a load on the drives:
[root@jakku ~]# dd if=/tmp/1g.bin of=/dev/null bs=1M && dd if=/tmp/1g.bin of=/dev/null bs=1M
Monitoring the I/O usage by processes
As stated in the man page, iotop is a simple top-like I/O monitor. In our example, we see the process ID (TID) 14219, PRIO stands for scheduling class and priority (from the range 0-7, with lower number being the higher priority), who is running the command – the root user, and if its the read or write operation. If the operation is relying on swap, this would be stated in SWAPIN field.

To list only processes which are generating I/O load use the -o option when calling iotop.
[root@jakku tmp]# iotop -o
Alternatively you can press o, this would filter the list of processes to show only the high I/O tasks.
To exit the iotop utility, press control + C
Introduction to swap space and paging
Linux kernel divides the RAM into little pieces of memory called pages. When there is not enough RAM to process the current queue of tasks, paged piece of memory is copied to the preconfigured space on the hard disk called swap partition, swap file or swap space. The physical memory (RAM) and swap space together combine into virtual memory. No matter how fast the hard disk is, the swap operations are noticeably slower compared to read and write operations on the data stored in the RAM. You should not look at swap as the RAM extension, this mechanism is in place to avoid out of memory state, where system is trying to kill the resource intensive task. On a low end systems with little amount of memory installed, this is the only way to run some resource hungry tasks. Swap file can be easily enabled or disabled if required.
Verifying the swap memory performance (virtual memory)
vmstat gives you insight into the virtual memory statistics. The first row of the output is the average values since the last reboot. All the values by default are shown in kilobytes. For the megabytes use the -S switch.
vmstat -S M
Syntax wise:
vmstat [switch] [interval] [count]
Monitor and measure the network I/O
Netstat is a legacy utility replaced by the ss utility. Command on its own is listing all active sockets on all interfaces. You are likely to want to limit the output with switches. You may also want to grep for a specific information.
Proto stands for protocol tcp for ipv4 and tcp6 for ivp6. Local address 0.0.0.0 is a wildcard for the all IPv4 addresses on the local machine. [::] denotes ipv6 addresses.

Monitoring and collecting sockets statistics
ss is the tool built to show the socket statistics. If you just type ss and press enter you are likely to be overwhelmed with the results. You may wish to filter it down to TCP or UDP sockets. Some most commonly used switches are listed below:
-t to display the TCP sockets
-a to show listening and established sockets

TCP/IP Network monitoring
iptraf provides the system administrator with the IP traffic over the network interfaces statistics. On newer distributions such as CentOS 8 utility is called iptraf-ng instead. This menu based utility is capable of sniffing the TCP/IP traffic allowing the system administrator to see how many connections are there and from which IP address they are coming from.
Process management
ps allows you to create a snapshot of the currently running processes. This command provides you with static output, for continuous output use top.
[root@jakku tmp]# ps -u apache
PID TTY     TIME CMD
1300 ?    00:00:00 php-fpm
1308 ?    00:00:00 php-fpm
 48749 ?    00:00:00 httpd
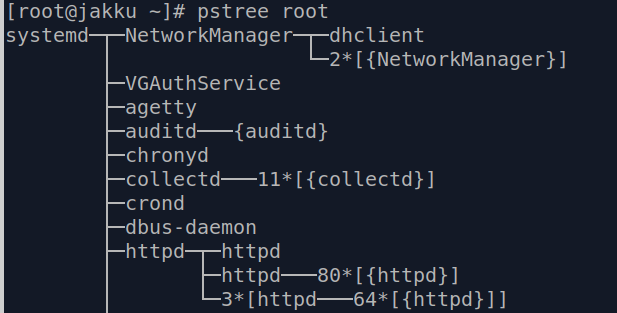
Generating a tree view of the processes
If you wish to generate a tree view of the given process this is where pstree kicks into play.

Monitor network I/O usage per process
lsof is another tool, which allows us to spy on the processes and list open files. Command on its own will flood you with the excessive amount of output regarding streams, block special files, libraries or network files. If you want to parse the output of the command in perl or awk, us the -F flag.
The popular way to filter it would be with the commands below:
lsof | grep apache

lsof -ni TCP
Collecting the system activity information
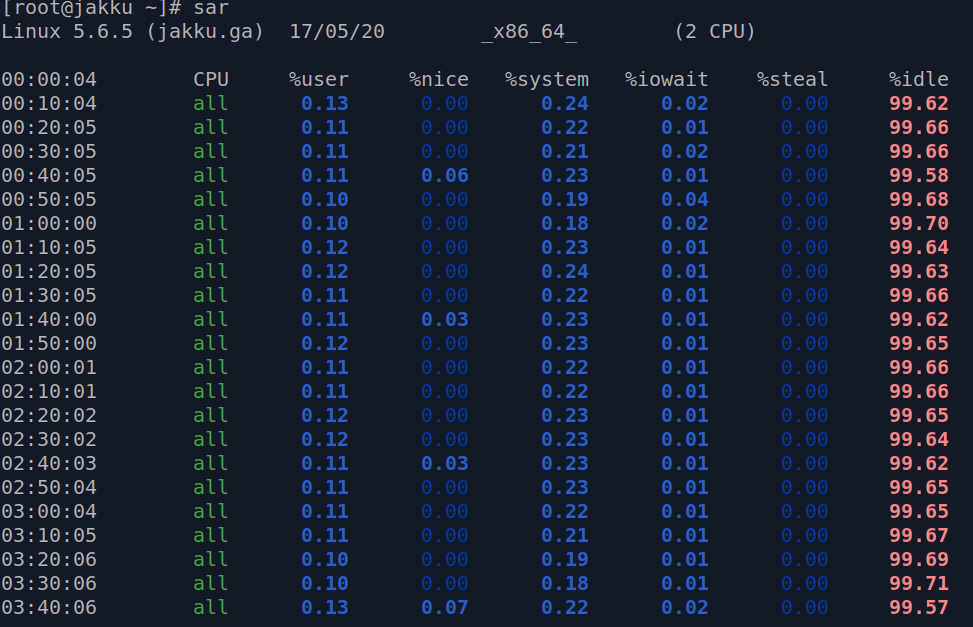
sar is the utility which logs the system activity on 10 minute intervals to the log file. This is really useful when you wish to create a baseline of your system or to spot the spikes in the system load. Command on its own prints the CPU statistics in 10 minute intervals.
On the centos 8 system, logs are stored in /var/log/sa directory. Files in this directory do not contain a plain text. They can be read with the sar command.
Switches I use the most often are:
-d for the disk I/O statistics
-r for the memory and swap statistics
To read from the file called sa01 use the command below:
[root@jakku sa]# sar -f /var/log/sa/sa01
Example output of the sar command:

How to verify who is logged on to the system and what they are doing.
If you type w command it should show you enough information to get an idea on what the users are doing and if the system is under heavy load (load average)
[root@jakku tmp]# w
 21:39:25 up 18 days, 9:45, 2 users, load average: 0.04, 0.03, 0.00
USER   TTY   FROM       LOGIN@  IDLE  JCPU  PCPU WHAT
root   pts/0  XX.XXX.XX.XXX  12:13  7:33  0.07s 0.07s -bash
root   pts/1  XX.XXX.XX.XXX  15:04  0.00s 0.09s 0.00s w